atoptool.nl
News
In text mode the full-screen output of atop consists of a top half with
system level statistics and a bottom half with process level statistics.
The type of process level statistics can be modified by pressing certain
keys, as shown by these screen shots.
This page does not describe the meaning of every single counter.
You can find a full description in the atop manual page.
Notice that for some screenshots an additional example is provided showing
the dynamic extension of columns whenever
the window has been widened (more than 80 positions).

Generic information — default
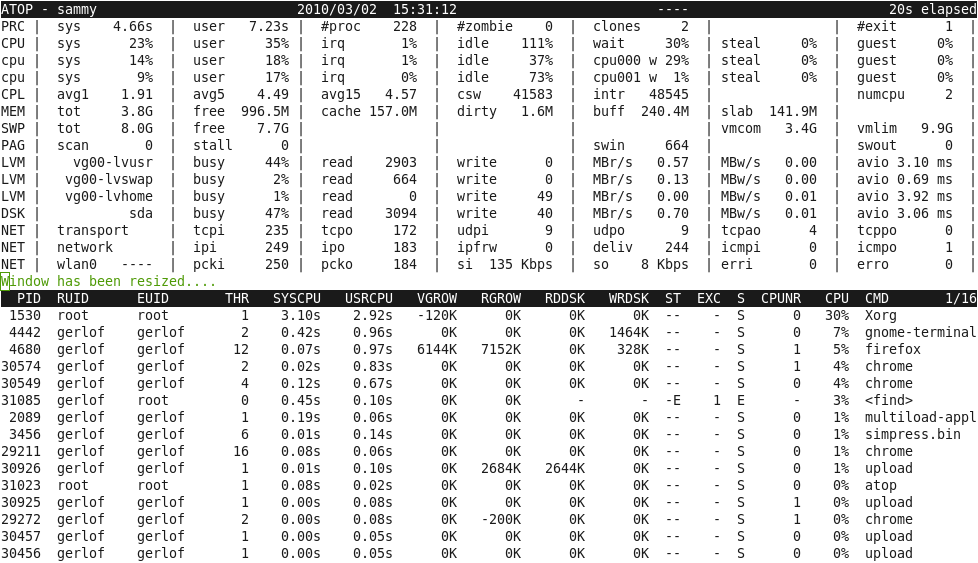
The generic screen gives an overview of the consumption on system and process level of the four major hardware resources, i.e. cpu, memory, disk and network. Since the kernel does not maintain per-process network statistics, network consumption on process level is only shown when you have installed the netatop kernel module.
Some details: In the line with the label PRC the counter '#exit' shows that one process has finished during the last interval. The bottom half shows which process: process 'find' with process-id 31085. Before it died, it has consumed .45 seconds cpu-time in system mode and .10 seconds cpu-time in user mode, so .55 cpu-seconds in total (2.75% of one cpu during the interval of 20 seconds). The column ST (state) shows 'E' (exit) and the column EXCODE shows the process' exit code 1 (an exit code of 0 would indicate a normal run).
Generic information — default (wider window)
When this wider screenshot is compared with the previous one, real and effective uid are shown now, and the number of threads and current cpu-number for the main thread.

Bar graph mode resource utilization — key 'B'
This screen shows the utilization of the processors, memory/swap, disks and
network interfaces as (character-based) bar graphs in four separate windows.
When you want to view more detailed information on system level or
when you want to view the resource consumption on process or thread level,
you can switch to text mode by pressing the 'B' key.
Alternatively, you can use the 'B' key (again) to switch from text mode to bar graph mode.
You can start atop with the '-B' flag in bar graph mode right away which is
also convenient to watch the samples in a raw log file,
e.g. to view yesterday's system behavior with the command:
atop -Br y
Details for processors: The first column 'Avg' (or 'Av' or 'A') shows the average CPU utilization, followed by a column for every single CPU (or the most active CPUs when there is not enough space to show all CPUs). Per bar the utilization categories are shown, like 'S' (system mode), 'U' (user mode), 'I' (interrupt handling) or 'G' (guest, i.e. capacity consumed by the VMs on this host).
Details for disks (SSD or HDD): For every disk a bar is shown with the utilization categories 'R' (read) and 'W' (write).
Details for network interfaces: Per network interface the separate bandwidth is shown indicating 'TX' (transmit) and 'RX' (receive). Notice that the utilization is not shown as a percentage because the maximum bandwidth is not known for most (virtual) interfaces.
Details for memory and swap: For memory and swap the different usage categories are shown, like slab caches, shared memory, page cache (potentially free memory used as disk cache) and free memory. Also event counters are shown for page scans (per second), swapouts (per second) and oomkills.

Scheduling information — key 's'
This screen shows specific scheduling information about the main thread
of each process, like scheduling policy, nice value, priority, realtime
priority and cpu-number (current or last used) and state.
Furthermore it shows
how many threads within this process are in state 'running' (busy on cpu
or waiting in the runqueue), 'interruptible sleeping' or
'non-interruptible sleeping'.
Notice that the utilization is not shown as a percentage because the maximum bandwidth
is not known for most (virtual) interfaces.
Some details for memory and swap: For memory and swap the different usage categories are shown, like slab caches, shared memory, page cache (potentially free memory used as disk cache) and free memory. Also event counters are shown for page scanning, swapout and oomkills.
Scheduling information — key 's'
This screen shows specific scheduling information about the main thread
of each process, like scheduling policy, nice value, priority, realtime
priority and cpu-number (current or last used) and state.
Furthermore it shows
how many threads within this process are in state 'running' (busy on cpu
or waiting in the runqueue), 'interruptible sleeping' or
'non-interruptible sleeping'.
The total number of threads can be determined by accumulating
these three values (columns TRUN, TSLPI and TSLPU).
Some details:
The process 'chrome' with process-id 30549 runs with 4 threads in total;
one of these threads is 'running' and three are interruptible sleeping.
The running thread appears to be the main thread of the process, because
the state of the main thread (column S) is 'R'.
The process 'firefox' with process-id 4680 runs with 8 threads in total
from which one is 'running' (but not the main thread).
Memory consumption — key 'm'
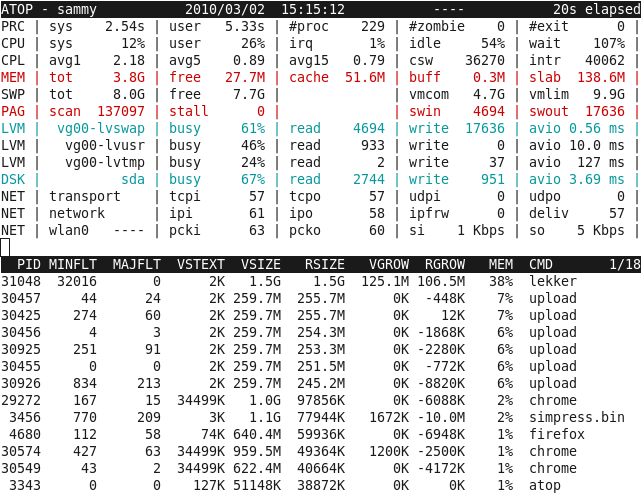
This screen shows specific memory-related information per process like total virtual and resident size (column VSIZE and RSIZE) and the virtual and resident growth during the last interval (column VGROW and RGROW). The memory percentage (column MEM) shows the resident memory occupation by this process, because that is what matters when your system starts swapping.
Some details:
In the line with the label PAG the counters 'swin' (swapins) and
'swout' (swapouts) show that this system suffers from a memory-overload.
In the line with label LVM for logical volume 'vg00-lvswap' the 'read' and
'write' counters exactly match with the 'swin' and 'swout' counters.
This logical volume is also most reponsible for the heavy load
on the underlying disk 'sda'.
On process level a lot of negative resident growth (column RGROW) can be seen
because processes loose their resident pages by swapout.
It appears that process 'lekker' with process-id 31048
grows heavily due to a memory leakage; its resident size is currently
1.5 GiB (total memory 3.8 GiB).
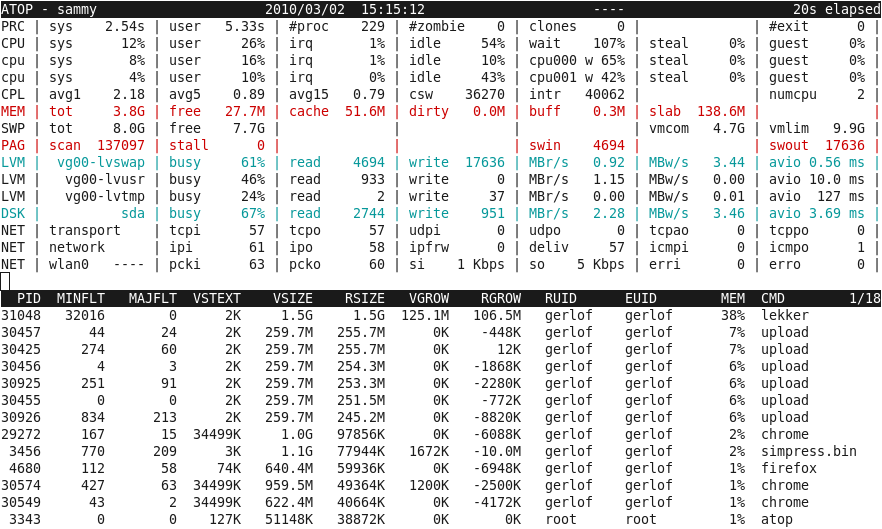
Memory consumption — key 'm' (wider window)
When this wider screenshot is compared with the previous one, the real and effective uid are shown now.
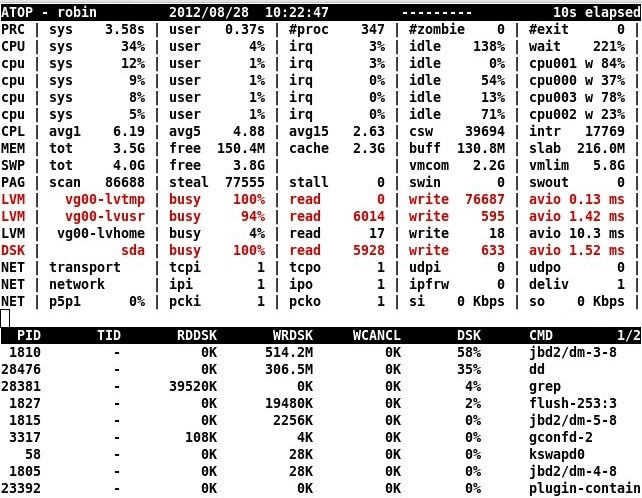
Disk utilization — key 'd'
The lines with label LVM (logical volumes) and DSK (underlying physical disks) shows the disk-activity on system level.
On process level the disk activity is shown as the amount of data transferred
by reads (column RDDSK) and writes (column WRDSK). Usually the written
data is stored in the in-memory page cache before it is physically
written to disk. When the data is written to the page cache but
destroyed before physically written to disk, that amount is reported
as cancelled (column WCANCL).
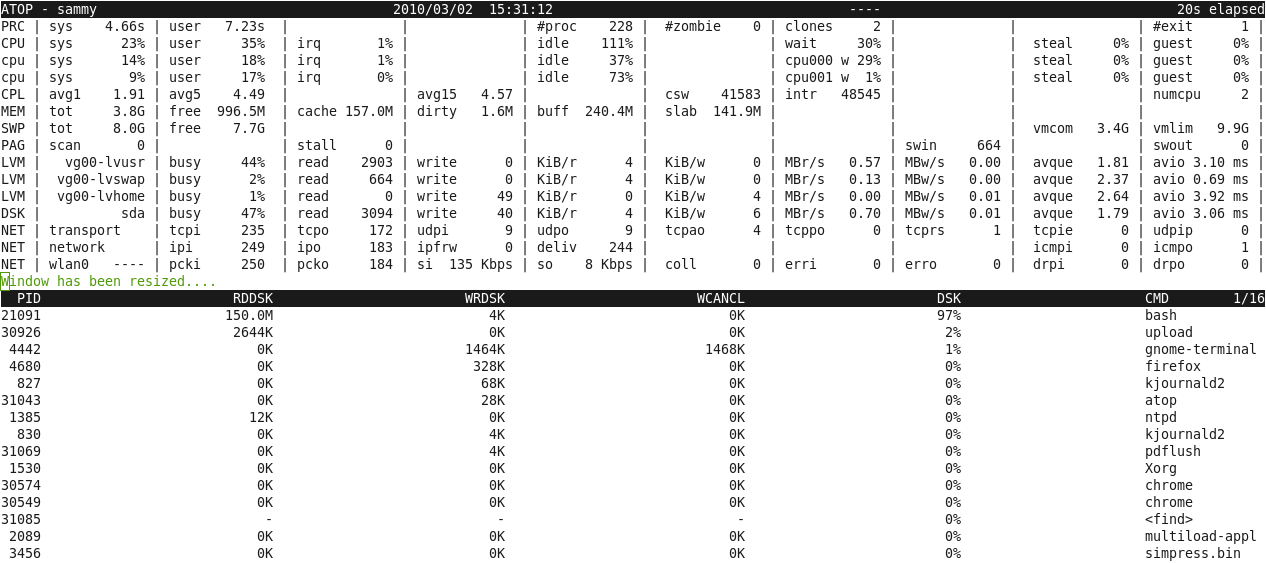
Disk utilization — key 'd' (wider window)
When this wider screenshot is compared with the previous one, columns are added for the system level statistics, like the number of KiB transferred per read and write request, the total throughput per second for reading and writing, and the average number of requests in the request-queue of the disk driver.
Some details:
The line with the label DSK shows that disk 'sda' is 47% busy during
the last interval, issueing 3096 read requests and 40 write requests.
So most disk-utilization is caused by processes that are reading.
The process that has read most data seems to be 'bash' with process-id 21091.
That process transferred 150MB (which is 97% of all accounted
disk transfer). Since other processes did not transfer much data,
'bash' seems to have made the disk 47% busy during an interval of 20 seconds,
which can not be true....
And it is not true! The process 'find' with process-id 31085
has issued most disk-transfers, but it has finished during the interval.
In that case atop obtains its information from the process
accounting record of the exited process, however unfortunately
the number of disk transfer is not registered there....
Another complicating factor is, that the kernel adds the accounted disk transfer figures
of a child process to its parent whenever the child process exits. Therefore, probably
'bash' did not issue any disk transfer (the 150MiB data that was accounted to 'bash' in
reality has been read by 'find').

Variable information — key 'v'
This screen shows miscellaneous information about processes, like credentials (real uid and real gid), parent process-id, start date and start time, etcetera.

Variable information — key 'v' (wider window)
When this wider screenshot is compared with the previous one, all flavors of uid and gid are shown now, and the exact end data and end time is shown for processes that finished during the interval.

Command line — key 'c'
This screen shows the command line of the processes. If the window is widened, more command line arguments are shown.
the accumulated virtual and resident memory consumption (notice that the shared parts are accounted for every process, so this is far too high), the accumulated transferred data from/to disk and (only in case the netatop module is active) the accumulated network transfers.
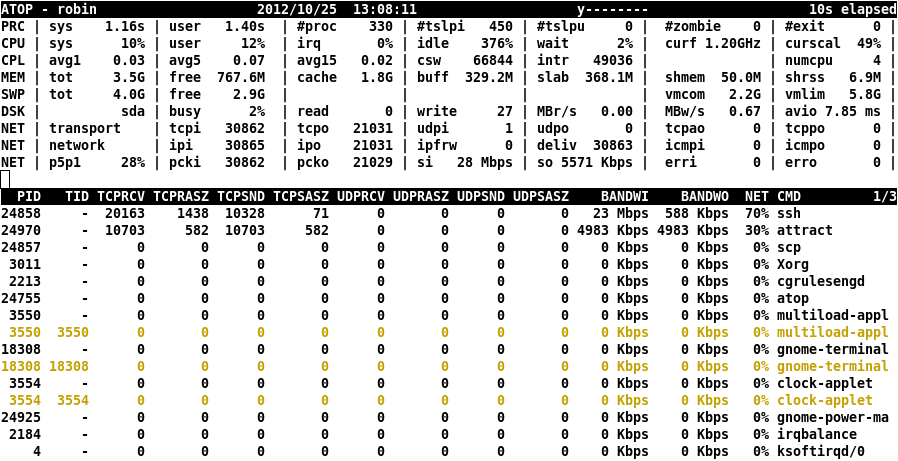
Network utilization — key 'n' (with netatop module)
This screen shows the network activity per process when the kernel module netatop is loaded. With this module, network transfers are accounted to the concerning process and thread. The number of receives and sends are shown for TCP and UDP, even for finished processes when the netatopd daemon is active. If the window is widened, also the average size per transfer is shown (like in this example). Notice that the utilization on interface level can be easily correlated to the bandwidth used per process: 'si' for interface p5p1 shows 28 Mbps for input from which 23 Mbps ('BANDWI') is consumed by 'ssh' and almost 5 Mbps by 'attract', while 'so' for interface p5p1 shows 5571 Kbps for output from which 588 Kbps ('BANDWO') is consumed by 'ssh' and 4983 Kbps by 'attract'.